

When the Data is Noisy

An Economics Class Explainer of GDP
Curriculum Specifications
- Course: Social Studies, Specifically Economics
- Educational Level: High School
- Reading Level: 6.46
- 12 Minute Read
The other day it was reported that in the first quarter of the year the economy contracted. In other words, it produced less than it did the previous quarter.
This is a significant concern. Business owners make their decisions about how much to invest based on whether they feel the economy will grow or contract. They make these decisions by looking at data like Real Gross Domestic Product (GDP). If they see that the economy is growing, they can feel pretty good about increasing their investments. That means taking out loans to expand their businesses, buy more production goods, hire more people, maybe offer better pay and benefits. On the other hand, if they see the economy shrinking, and they have reason to believe that the economy will continue to shrink, they are likely to hold onto their money and avoid the risk of further investment. That means fewer jobs, and less money available in the market. So, data like GDP is really important for helping investors make decisions.
So, when GDP reported for the first quarter of the year1 showed that the economy had contracted, there was a bit of panic. Investments fell, and uncertainty increased. You may be hearing talk of an impending recession…which is scary. What’s going on?
Well, it’s hard to say exactly at this point. The problem is that we are dealing with a major disruption to how the economy has functioned since the end of World War II. This disruption has been sudden and is creating what economists call “noise” in the data.
So, let’s take a look at this data and examine some of the noise. This gives us a good opportunity to learn a little about GDP as a measure of the economy and the limits of what it can tell us.
A Primer on GDP
Great! Let’s start with what GDP is…
Fair enough.
GDP is Gross Domestic Product. In simplest terms, it estimates the total (the “gross” part) domestic production of a nation. Domestic refers to what is happening within the borders of the nation. Production refers to all of the goods and services provided within the nation’s borders. Gross Domestic Product does this by looking at how much goods and services consumers purchase.
So, it’s a bit weird. We are getting an estimate of how much the United States has produced by looking at how much Americans are consuming. It’s an indirect measure.
GDP was created by an economist named Simon Kuznets in an attempt to understand the impacts of the Great Depression. It is intended as a method for measuring the total value of the goods and services produced in a country. That’s why it focuses on purchases. It is through decisions made in the market that value is determined. It’s not a perfect measure, but since the 1930s, GDP has been the main “report card” for the nation’s economy. Normally, it’s just a boring byline in the business section of the news.
When things are unstable and uncertain, however, boring GDP finds itself on the head banner of the website. Business owners are especially attuned to GDP.
For instance, as the owner of a shoe factory, I purchase so many materials to make a thousand shoes. In making that purchase, I’m consuming the value added by those who are supplying the leather, the thread, the rubber, etc. I pay my workers to operate the machines that make the shoes. Shoe store owners purchase my shoes to make them available in the market where consumers then purchase them. They may not purchase all of my shoes. Some of my shoes will stay on the shelves. But they still represent the purchase of materials.2
GDP tries to capture all of this value added. Now, there are different approaches to doing this, but the fundamental formula is the following:
GDP = C + I + G + {X – Im}
What the heck! That math without numbers crap!
Relax. It’s easy. Look:
- C = Consumer spending…the stuff you buy at the store
- I = Investment…the stuff businesses buy
- G = Government spending…the stuff governments buy
- X = Exports…the stuff other countries buy from us
- Im = Imports…the stuff we buy from other countries
- {X – Im} = Net Exports (NX) Exports minus Imports
To get an idea of the total productive output of the nation, we add these categories up. On the other hand, we have to subtract out the imports because they represent money that is leaving the country. If I own a shoe store and I buy shoes from a Chinese company, I’m sending money to China to get the shoes.
Not to worry. You as the consumer are coming into my store and buying those same shoes, which comes under the “C” part of the equation. So your positive “C” contribution, in normal times, simply cancels out my negative “Im” contribution to the formula. That’s why economists point out that Imports are not bad. If I can buy better quality shoes at a lower price, then that will increase my sales and my profits. But imports do have to be accounted differently in GDP.
Ok…I’m with you
Good, because this is where the “noise” comes from.
Oh, great! You know how much I like freakin’ noise!
The Current Situation

Reading a Real Gross Domestic Product Line Chart
This chart shows the change in Real Gross Domestic Product from the previous quarter. If you look at the blue line on the far left of the chart you see that GDP for Q1 2024 had increased about 1.6% from Q4 2023. Q2 2024 increased another 3% from Q1 2024. That would be a net increase of 4.6% for the year. If you look at the far right, you see that Q1 2025 recorded a .3% decrease as compared to Q4 2024.
Yeah. Let’s take a look at the data that is causing all the commotion

This graph shows Real Gross Domestic Product from Quarter 1 (Q1) 2024 to Q1 2025.3 As you can see, in Q1 2025, the line dips below the 0 a bit. This represents a contraction in GDP.
Yeah! What happened?
Frankly, most economists were expecting GDP to be lower in Q1. That’s because of the tariffs that have been instituted by the current Administration.4 Tariffs cause prices to increase. The Law of Demand predicts that an increase in prices will cause a decrease in demand for those goods. It’s real simple. If you have to pay more for a good or service, you are less likely to want that good or service. We can see this expressed in the Demand Curve below.

Based on the Law of Demand, a lower GDP is predictable. That’s why we use these models…to make predictions.
But why should it be negative? After all, it’s not like we’ve seen major layoffs and business shutting down. There still seems to be the same amount of stuff on the shelves, and the stores seem to be just as crowded. What’s going on?
Yeah! Is this some conspiracy to trick us into thinking things are bad?
No. It’s not.
This is where we start looking at the “noise” I mentioned earlier in this piece. When economists talk about noise in the data, they are referencing extraneous stuff that isn’t accounted for but is still reflected in the data. It’s like trying to listen to someone tell a story during a rock concert. You’re probably going to miss something.
It’s important to filter out the noise if you want to understand what the data is telling you. Does the negative GDP indicate a contraction in the economy?
In this case, no.
The noise is coming from that troublesome “Im” part of the equation. That’s the imports.

See, in normal times, I as a shoe store owner will import about as many shoes as I think I can sell within a given time period. If my estimates are good…and really, why wouldn’t they be?…then the amount I spent on imports is canceled out by the amount consumers paid to buy the shoes. From a GDP standpoint, it’s a wash.
But in normal times, tariffs are low and likely remain low in the future. That changed when the President imposed tariffs and nations responded with their own tariffs. That was the end of the GATT/WTO system.5
The prospect of high tariffs, especially on China,6 has impacted the incentives of business owners. As a shoe store owner, I was incentivized by impending tariffs to import as many shoes as I could before the tariffs kicked in. Normally, I would only import as many shoes as I could predict I would sell. I don’t want the added costs of warehousing unsold shoes.
Now, however, the costs of warehousing unsold shoes are significantly less than the costs of purchasing the shoes under the tariff regime. So, I purchased more shoes than I needed, with the intent of warehousing them for the future. In economic terms, I increased my Inventory.
This distorts the equation. Now, the net impact of Imports and consumption is no longer a wash. Now, consumers, the “C” in the equation, will not purchase all of the shoes I imported. The net impact on GDP is negative rather than zero.
Did businesses actually import so much that it made GDP look negative?
Yeah. It appears so.

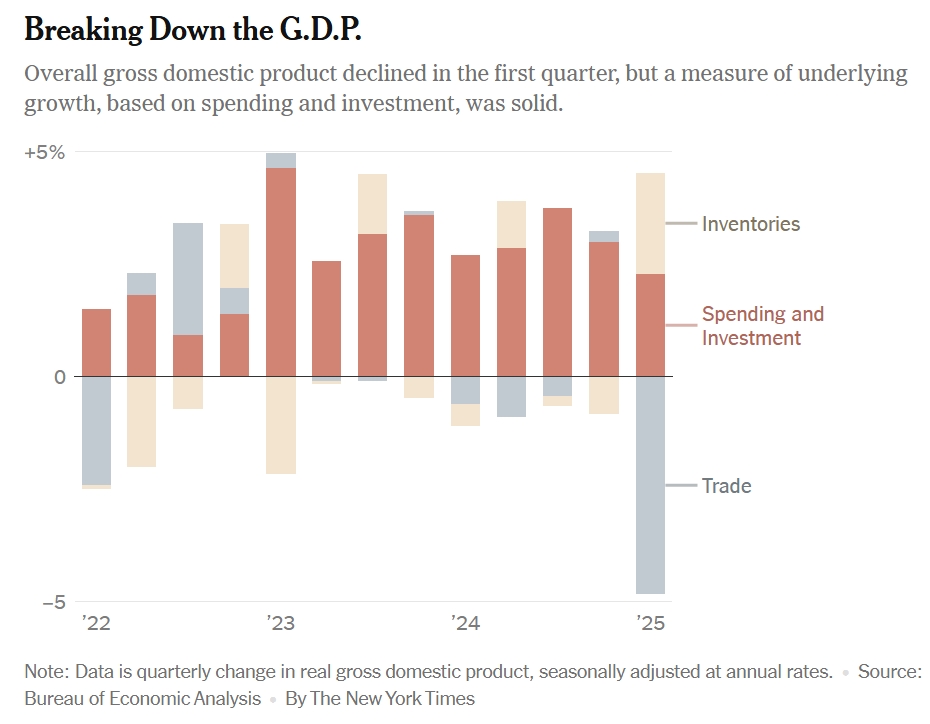
Here’s the breakdown that I took from Apricitas Economics on Substack. It is a breakdown of data provided by the Bureau of Economic Analysis. You can see that almost all of the economic contraction revealed by Real GDP is accounted for by negative NX with some cuts to government spending contributing a small amount.
For a further breakdown, you can go to the Bureau of Economic Analysis and find this graph.7

It looks like Consumer spending (C) is still growing, and Investment (I) is still pretty strong. Exports, however, are looking pretty anemic. That may be a result of other countries responding to U.S. tariffs by raising their own import barriers. Imports, however, was an extreme outlier.
When you clear out the noise, you get a better picture of what’s going on. The incentive to increase imports has distorted the Q1 Real GDP results showing an economy that is weaker than it really is.
Nothing to Worry About
Well, that doesn’t look so bad when you put it this way. So…nothing to worry about, then.
Weeeelllllll
Oh, great! Here we go!
That’s the thing. The United States juiced its imports to mitigate or delay the impact of tariffs on goods and services. But that’s the thing. This is a stopgap measure. The shoes in the warehouse, my inventory, isn’t going to last forever. At some point my inventories are going to fall, and I’m going to have impose higher prices on my consumers. The question is, do I do it now and slowly raise the prices so that there is no sticker shock when I run out of my surplus shoes, or do I hold my prices down until the last minute, in which case consumers are going to notice a sharp price increase?
As a consumer, do I buy shoes now even though I don’t need new shoes, and thus avoid having to pay the extra tax? That way I can go a longer time without having to buy shoes. This means that spending I might do in the future is likely to not happen.
These decisions being made, what does that mean for people who work at the shoe store? When do I have to start cutting back on my labor costs and let people go? Will there be enough of an increase in domestic shoe factories to absorb people who will likely lose their jobs for companies based on imports that will now see a reduction in demand?
Also, as other nations raise their tariffs on American goods, what happens to workers in export industries? Where do those investments go?
Will the administration change its mind on tariffs and reverse them? Will businesses and consumers find ways to adjust and minimize the negative impacts enough to mitigate the short-term impacts and innovate new ways to grow the economy?
Look, there are are no clear answers to these questions at this point. Looking at the most recent Real GDP data may inspire these questions but does nothing to help us answer them.
What we can say is that the reality at this point is not as bad as is reflected in the data. Quarter 2’s results may be equally distorted as NX balances out. Consumption may remain high because people are buying up the surplus inventory, and may be incentivized to do so before the tariffs really kick in. The question is what will happen to Investment.
Some economists are predicting that Q2 will be just as noisy as Q1, only this time it may show that the economy is doing better than it is in reality.
These are predictions, and just like any predictions, they may not come true.
It is good, however, that you are asking these questions and paying attention to data to reason through the answers.
Footnotes
- GDP is usually reported in quarters, or three months periods. I won’t get into the particulars on this. ↩︎
- You can see that this isn’t comprehensive. For instance, if I buy a pair of shoes and then decided to donate those shoes to clothes bank where they are purchased by someone else, that’s not included. The reason for this is because there is no “value added” in the transaction. It’s still the same old shoes. ↩︎
- Whenever you see the word “Real” in the description of economic data, that means that the information is controlling for inflation. This is important because GDP uses prices to determine output. If GDP increased by 5%, but prices increased by 5% at the same time, that means that the increase in GDP is explained entirely by the increase in prices, not an increase in value. So, Real GDP in this case would be 0. Ideally, economic policy wonks want to see GDP increase more than inflation. That’s why we look at Real GDP rather than just what’s called Nominal GDP. ↩︎
- This was discussed in a previous blog post: https://mrandosciasclassroom.net/2025/03/14/so-are-tariffs-good-or-bad/ ↩︎
- After World War II advanced nations got together and decided to make it easier to conduct trade. They pursued what is called “Free Trade” policies. In other words, they incentivized trade by lowering the barriers to trade in their countries, like quotas, embargoes, and tariffs. They believed that this was a great way to take maximize each nation’s Comparative Advantage. It was also believed that making nations mutually dependent on each other for trade would make them less inclined to go to war. They formalized this plan with the General Agreement on Tariffs and Trade, later institutionalized in World Trade Organization (WTO). Low tariffs and free trade have been the hallmarks of the modern world economy ever since…until now. ↩︎
- China is a specific target of the highest tariffs being imposed. You can get a breakdown here. https://www.project44.com/tariff-tracker/ ↩︎
- Always follow the links to the primary sources. ↩︎

If you are a fan of historical fiction, and looking for a good immigration story, my novel Stone is not Forever is right up your alley. This is a powerful story of an Italian immigrant at the turn of the 20th century who risks everything to come to the United States. At first, his goal is to earn enough money to become a man of respect in his village, but life takes a different turn. Dominico faces hardship, heartbreak, and illness. He fights for fair pay and worker’s rights on the streets of New York at the height of the turbulent and often violence labor unrest. He finds himself on the battlefields of World War I, fighting under an American flag, wearing an American uniform. This novel deals with love and loss, ambition and poverty, politics and the morality of a just society. In the end, it’s the story of how a young Italian craftsman becomes an American. Purchase your copy today. Click Here
