

Introduction to Sociology: Sociological Research
Prologue
“I think for myself. I do my own research.”
You may have heard someone say this before. Something like this is often heard during discussions, debates, or arguments on timely topics like politics or current events. It’s often used in a derogatory sense in terms of “I don’t trust the mainstream media, or the so-called experts. So, I do my own research…” the inference being that whatever research this person did is of higher quality than that conducted by professionals.

The problem is, such claims are almost always not true. When someone says they do their own research, the chances are pretty good that what they mean is they did a Google Search of someone else’s research and, if they liked what they saw, they incorporated that into their own analysis.
And I’m not saying this as a criticism. This is fine. I do this all the time. I’ve been trained to do research, but if you look at the stuff I write on this website and the Mad Sociologist Blog, most of what I do is an analysis of existing research, not my own research. Doing my own research is hard, and time consuming, and sometimes expensive. Furthermore, though I’ve been trained to do research, there are folks out there who are a lot better at it than I am, and have years’ experience in their fields that I don’t have. If they’ve already done the research that I’m interested in, it doesn’t make sense to do my own.
To say you have done your own research, you must satisfy one of two criteria. First, you went into the field and collected your own data. This is called Primary Data. This goes beyond sitting in a bar and chatting with your friends about politics and they all agree with your position. I mean, that’s a kind of research, but it certainly will not pass any tests of validity.
The second criterion is to find a dataset that is already available and design a model for evaluating the data for what you are looking for. There is plenty of raw public data available, but to use that data in any reasonable way, you should have a background knowledge in statistics. Your data will likely be valid, but what you are studying may not be reliable.
You can do this stuff, but the chances are, you’re not. Instead, what you are doing is looking at other people’s research. The big danger here is what we call confirmation bias. You scan for research that confirms your preconceived notion. Once you fight it, you consider your research done. Not good. You should definitely research the available data on topics in which you are interested, but there are steps you need to take ensure that you are not simply reinforcing your own bias. You must know how to evaluate the research that you are looking at in order to test for validity, as well as look for research that corroborates the conclusions, testing for reliability.

This course can help you with “doing your own research” whether that means actually collecting or collating raw data or analyzing existing research. This course was designed for AICE Sociology Students, to help them pass their papers. However, it is a good tool for any sociology enthusiast or undergraduate level sociology student. Most importantly, anyone who is interested in more than winning arguments, in actually being right, can benefit from this course.
After taking this course, you will know:
- Different kinds of sociological research
- The strengths and weaknesses of these different kinds of research
- The ethical considerations
- How sociologists conduct research
- How to evaluate research
- The relationship between research and theory
- How to incorporate sociological research into your writing
AICE Review Quantitative and Qualitative Research
Lesson 1: Quantitative Research
Resources
Quantitative Research AICE Test Prep
Slideshow PDF
Quantitative Research: Written Chapter
Evaluating Quantitative Research
For those who like to “do their own research” one of the most useful tools in your toolbelt is in evaluating quantitative data. There’s an old line about Lies, Damned Lies, and Statistics. The truth is that quantitative research, done well, doesn’t lie. Sometimes, however, people lie using statistics. More often than not, they simply misunderstand what the study is saying
| Attribute | What to Look For | Why it Matters |
|---|---|---|
| What’s being studied | Clear research questions to be answered | The research will address only the research questions. Nothing more. Nothing less. Be careful not to infer more from the study than the study is intended to reveal. |
| Sample | Who is being studied? How many participated? Bigger and more representative is better. The more the merrier. | The sample should be representative of the population. Does the sample make sense? Were there people left out? Is the sample large enough to draw general conclusions? |
| Method | What kind of study was it? Survey? Experiment? Longitudinal? | Each method has some benefits and limitations. It’s a good idea to know what those are. |
| Bias and Control | In the methods section the researchers should explain how they controlled for bias. | The stronger the controls, the less the bias. Remember, there are always limitations. |
| Results | Does the researcher share the data clearly, offering the raw numbers and data tables? | You should be able to check their work. |
| Statistical Significance | Was a test of significance done and what were the results. You are normally looking for asterisks. *** The asterisks tell you how strong the data is. | If there are no asterisks that means, scientifically, the numbers cannot be relied upon. *= a less than 5% chance that the numbers are not reliable. **=less than a 1% chance the numbers are not reliable. ***=less than a .1% chance that the numbers are not reliable |
| Limitations | Did the researchers explain the limitations of the study and make suggestions for future studies to mitigate these limitations? | All studies have limitations. You need to know these if you are going to use them in your arguments or analysis. |
| Implications | What are the real-world applications of this research? | The research, especially in sociology, should matter to real life people. |
Here’s an example. Recently there has been a big rumpus over NAEP Reading Scores for 4th Grade. You see on the news how 4th grade NAEP Readings Scores have collapsed! What’s happening to our schools?
Well, here’s what the actual data looks like:
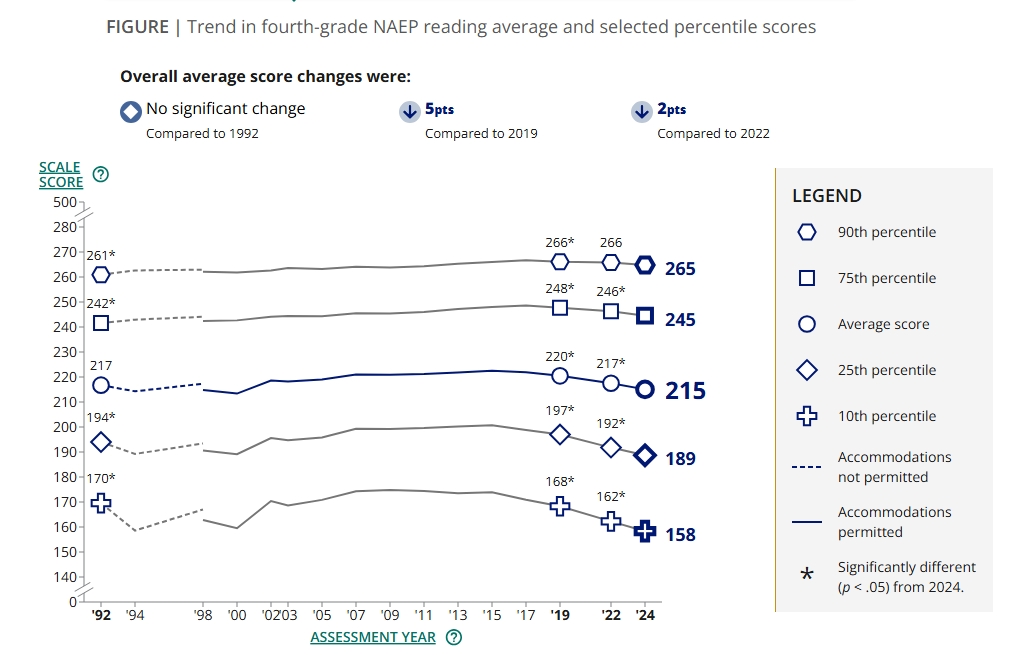
Um…yeah. That doesn’t look so scary. Yes, there’s been some decline, especially at the lower end of the spectrum. That definitely needs to be addressed. But this decline has been going on since its peak around 2011 for those scoring at the 10th percentile.
Yeah, but only 31% of 4th grade students are proficient in reading! That’s a crisis!
Maybe. How does that compare to other years? Here’s the breakdown…
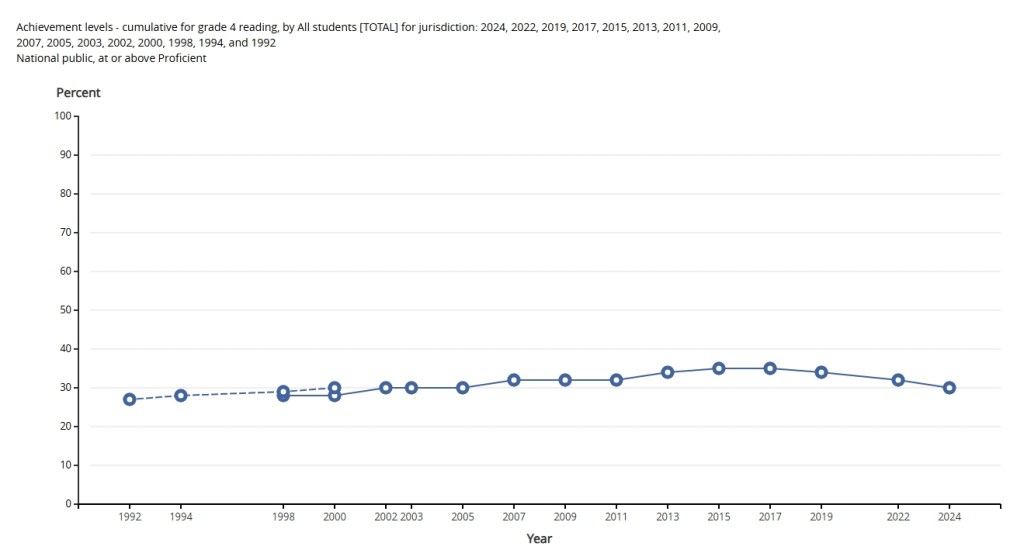
Kinda looks like students pretty much always score in and around 31% at the Proficient Level. Maybe this isn’t quite the crisis we thought it was. That’s not to say we can’t strive to improve these scores. It does suggest that it’s hard to understand why this is a crisis right now, but wasn’t a crisis in 2022, or 2019, or 1992.
When looking at quantitative data, it’s important that you ask some questions about what you are looking at. When you see a stand-alone stat like “only 31% of 4th grades students are scoring at or above proficient in reading!” you might want to stop and ask…and? What are we comparing this to? Often, stand-alone stats are designed to manipulate you.
Lesson 2: Statistics in Sociology
Okay! Okay! Don’t panic! No, this is not a math class. However, an understanding of basic statistics can be invaluable to the student of sociology. Why? Because if you want to read those quantitative studies, and you do, it would be nice to know what they are talking about. So, I’ve included a simple presentation with basic statistical terms that you should know. I’ve also included the Crash Course Statistics Course.
Introduction to Sociology Statistics Terms
Introduction to Sociology Statistics Terms PDF
| Takeaway | Explanation | |
|---|---|---|
| Size matters | The larger the sample size the more likely what you are looking at is “Valid” | A study consisting of fifteen people probably tells you nothing. A study consisting of fifteen hundred people is much better. Fifteen thousand, better still. |
| Repetition matters | If you find a study with some interesting results, withhold your opinion until you see other studies that confirm those results. | That first study claiming X will be on the first page of the news. The studies that failed to confirm X will not. |
| Sampling Matters | Does the study sample represent the population as a whole. You usually want a “Random Sample” (not always) | You polled your high school and discovered that most of them like a particular TV show. You have proven that teens in your school like the TV show. What about other schools, or the rest of the people in your community. |
| Asterisks Matter | Check the data tables for test of statistical significance, usually represented with asterisks. | No asterisk, it’s like there nothing to see. *It’s likely there’s something going on **It’s very likely there something going on ***It’s very very likely there’s something going on |
| Honesty Matters | Every study has its weaknesses and limitations. Honest researchers will point those out in the study itself. | This is usually in the Conclusion or Discussion section. |
You’ll often here that “statistics lie”. Well, that’s not true. Assuming the statistics are compiled in good faith, they are not lying. However, sometimes people use statistics to lie, or at best to present their agenda. When I first went to sociology school, I heard a news report saying that Sexual Assaults in my county had increased by 23%. That’s pretty alarming! So, I looked into the data. It was true. Sexual Assaults had increased by 23%. What was left out, however, was that the overall population had increased by just over 19% in the same time period. Most of the increase in Sexual Assaults was explained by an increase in population. The “Rate” hadn’t changed quite so much. But it did increase. What explains that other 4%? Well, the increased population was also a younger cohort than the existing population. Younger people are more likely to commit such assaults. Almost all of the variance was explained by demographic shifts, not something sinister going on in the culture. That’s not to say that it’s not important. It’s just that if we want to actually understand what’s going on, and maybe do something about it, it is important to get the big picture.
Here’s some more examples of things to look for in Bad Statistics!
Lesson 3 Qualitative Research
Quantitative research is the backbone of sociological science. It is a great way to get a big picture understanding of the social world. A talented quantitative researcher can take a complex issue like racism and break it down into measurable, numerical bits, giving a robust picture of what racism looks like and the consequences of racism in any give social situation. What the quantitative researcher has difficulty doing is offering an understanding of the lived experience of racism. For that, you need specialized researchers who can go directly into a field and ask questions about, and collect observations of racism as a lived experience…what it means to experience racism. For that, you need qualitative research.
Where Quantitative research breaks phenomena down into numbers, the qualitative researcher is looking for the narratives associated with the phenomena. Where the quantitative researcher, following a Positivist tradition, often uses deductive methods, the qualitative researcher is trained to use Inductive methods to identify patterns and make connections.
Qualitative Research: Written Chapter
PDF Presentation: Supplemental
Power Presentation Supplemental
Presentation Based on the Video
So, when we combine what we know about quantitative and qualitative methods, we can see how these practices work together to create a cohesive discipline. Arguably, the process starts with qualitative sociologists in the field making Inductive observations of some social phenomenon. Based on these observations, the researcher or theorists come along and develop a theory that can explain the social phenomenon and be generalized to other similar social experiences. Quantitative researchers then use deductive methods to test the validity of the theory. If the results of the quantitative research matches what the qualitative researcher sees in the field, we are likely looking at a valid theory for explaining the social phenomenon. If not, something is wrong.
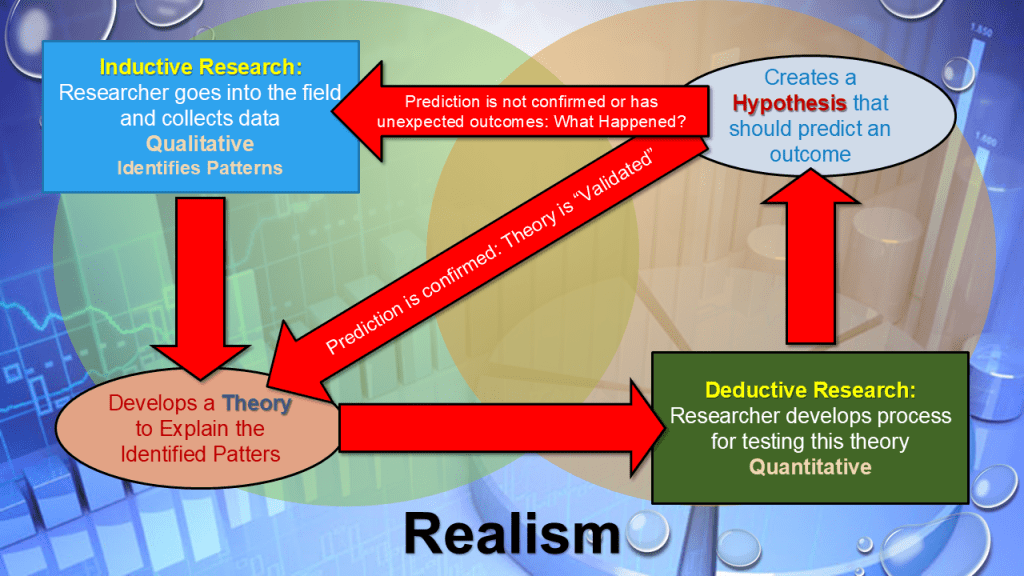
It’s important to note that in most situations, the results of quantitative and qualitative research rarely ever line up exactly. There’s always something missing, blanks to be filled in. That’s why the work of a sociologist is never complete.
A note on the word Theory: Remember from Course 1, a theory is a specific thing in science. A theory is an explanation for a phenomenon by which hypotheses can be developed to be tested. The way we often use theory in layman’s terms is wrong. Theories, Hypotheses, and Facts do not exist on a spectrum of development. A Theory never becomes a fact. A Hypothesis never becomes a theory. Rather, they are different tools used to describe the real world.
Lesson 4: Ethical Considerations
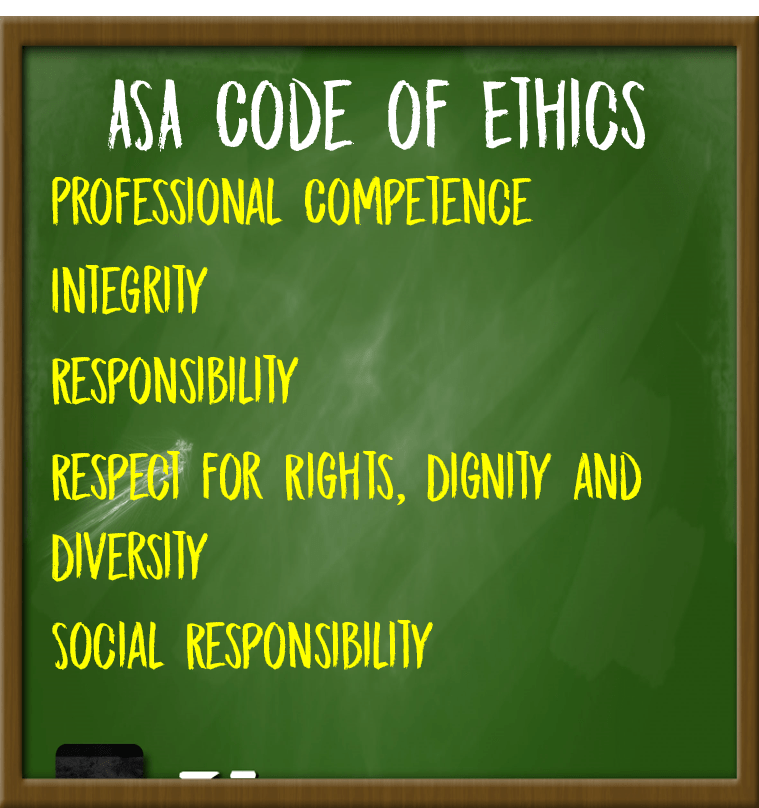
The most important thing sociology researchers, or researchers in any of the social sciences, must keep at the forefront of their minds is that their research subjects are human beings. Furthermore, sociologists are often not studying human beings in their best moments. For these reasons, the American Sociological Association, the professional association guiding standards in American Sociology, has developed strict ethical principles for conducting sociological research. Sociologists regard the protection of the people in their research setting as paramount. As you will see below, sociologists have even risked jail-time to protect the human beings under their observation.
Resources
Ethics in Sociological Research Written Chapter
American Sociological Association Code of Ethics
Sample Research. My graduate research was subject to a great deal of ethical debate between myself, my thesis committee, and the university IRB. Can you elaborate the ethical concerns and how these concerns were mitigated? Sample: Polymorphous Techniques of Power: Governing Sexuality in a Therapeutic Wilderness Program.
Easy Sociology Research Ethics Page
Notes Page with Discussion Questions
Ethics in Sociological Research Quiz
Ethics in Sociology PowerPoint
Coming Soon
Lesson 4: Writing a Sociological Essay

